Benchmarks
Scalability Benchmarks for Supabase Realtime.
This guide explores the scalability of Realtime's features: Broadcast, Presence, and Postgres Changes.
Methodology
- The benchmarks are conducted using k6, an open-source load testing tool, against a Realtime Cluster deployed on AWS.
- The cluster configurations use 2-6 nodes, tested in both single-region and multi-region setups, all connected to a single Supabase project.
- The load generators (k6 servers) are deployed on AWS to minimize network latency impact on the results.
- Tests are executed with a full load from the start without warm-up runs.
The metrics collected include: message throughput, latency percentiles, CPU and memory utilization, and connection success rates. Note that performance in production environments may vary based on factors such as network conditions, hardware specifications, and specific usage patterns.
Workloads
The proposed workloads are designed to demonstrate Supabase Realtime's throughput and scalability. These benchmarks focus on core functionality and common usage patterns. The benchmarking results include the following workloads:
- Broadcast Performance
- Payload Size Impact on Broadcast
- Large-Scale Broadcasting
- Authentication and New Connection Rate
- Database Events
Results
Broadcast: Using WebSockets
This workload evaluates the system's capacity to handle multiple concurrent WebSocket connections and sending Broadcast messages via the WebSocket. Each virtual user (VU) in the test:
- Establishes and maintains a WebSocket connection
- Joins two distinct channels:
- An echo channel (1 user per channel) for direct message reflection
- A broadcast channel (6 users per channel) for group communication
- Generates traffic by sending 2 messages per second to each joined channel for 10 minutes
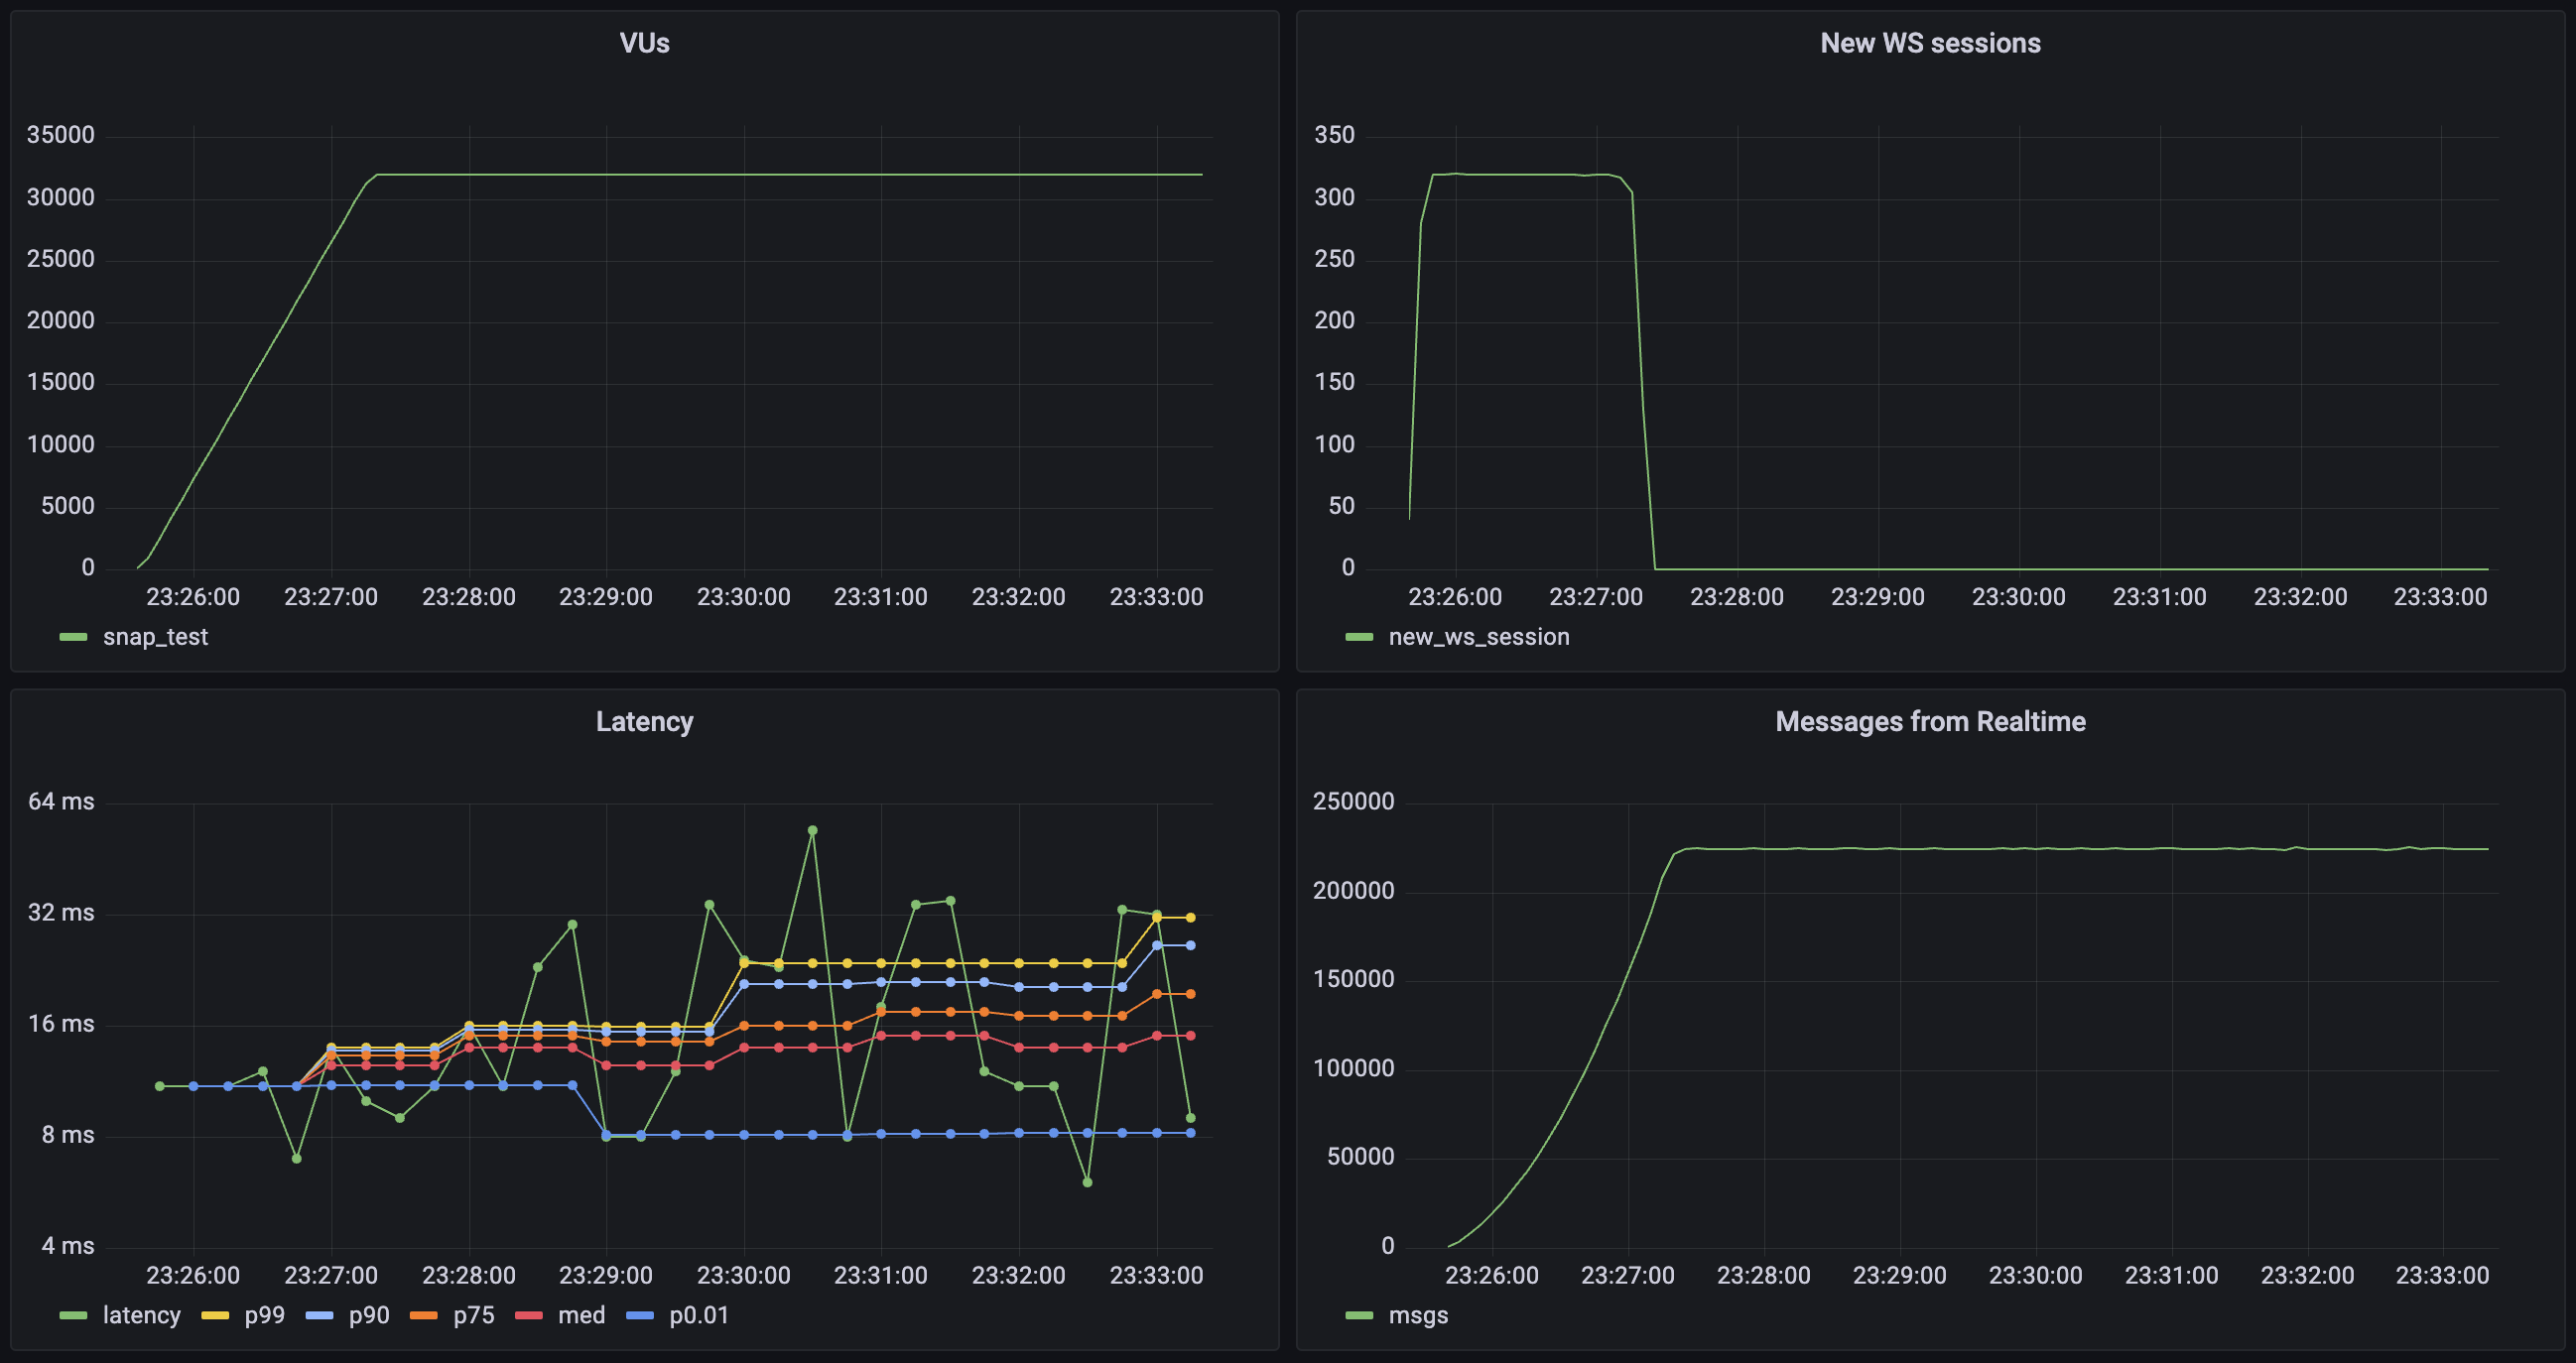
| Metric | Value |
|---|---|
| Concurrent Users | 32_000 |
| Total Channel Joins | 64_000 |
| Message Throughput | 224_000 msgs/sec |
| Median Latency | 6 ms |
| Latency (p95) | 28 ms |
| Latency (p99) | 213 ms |
| Data Received | 6.4 MB/s (7.9 GB total) |
| Data Sent | 23 KB/s (28 MB total) |
| New Connection Rate | 320 conn/sec |
| Channel Join Rate | 640 joins/sec |
Broadcast: Using the database
This workload evaluates the system's capacity to send Broadcast messages from the database using the realtime.broadcast_changes function. Each virtual user (VU) in the test:
- Establishes and maintains a WebSocket connection
- Joins a distinct channel:
- A single channel (100 users per channel) for group communication
- Database has a trigger set to run
realtime.broadcast_changeson every insert - Database triggers 10_000 inserts per second
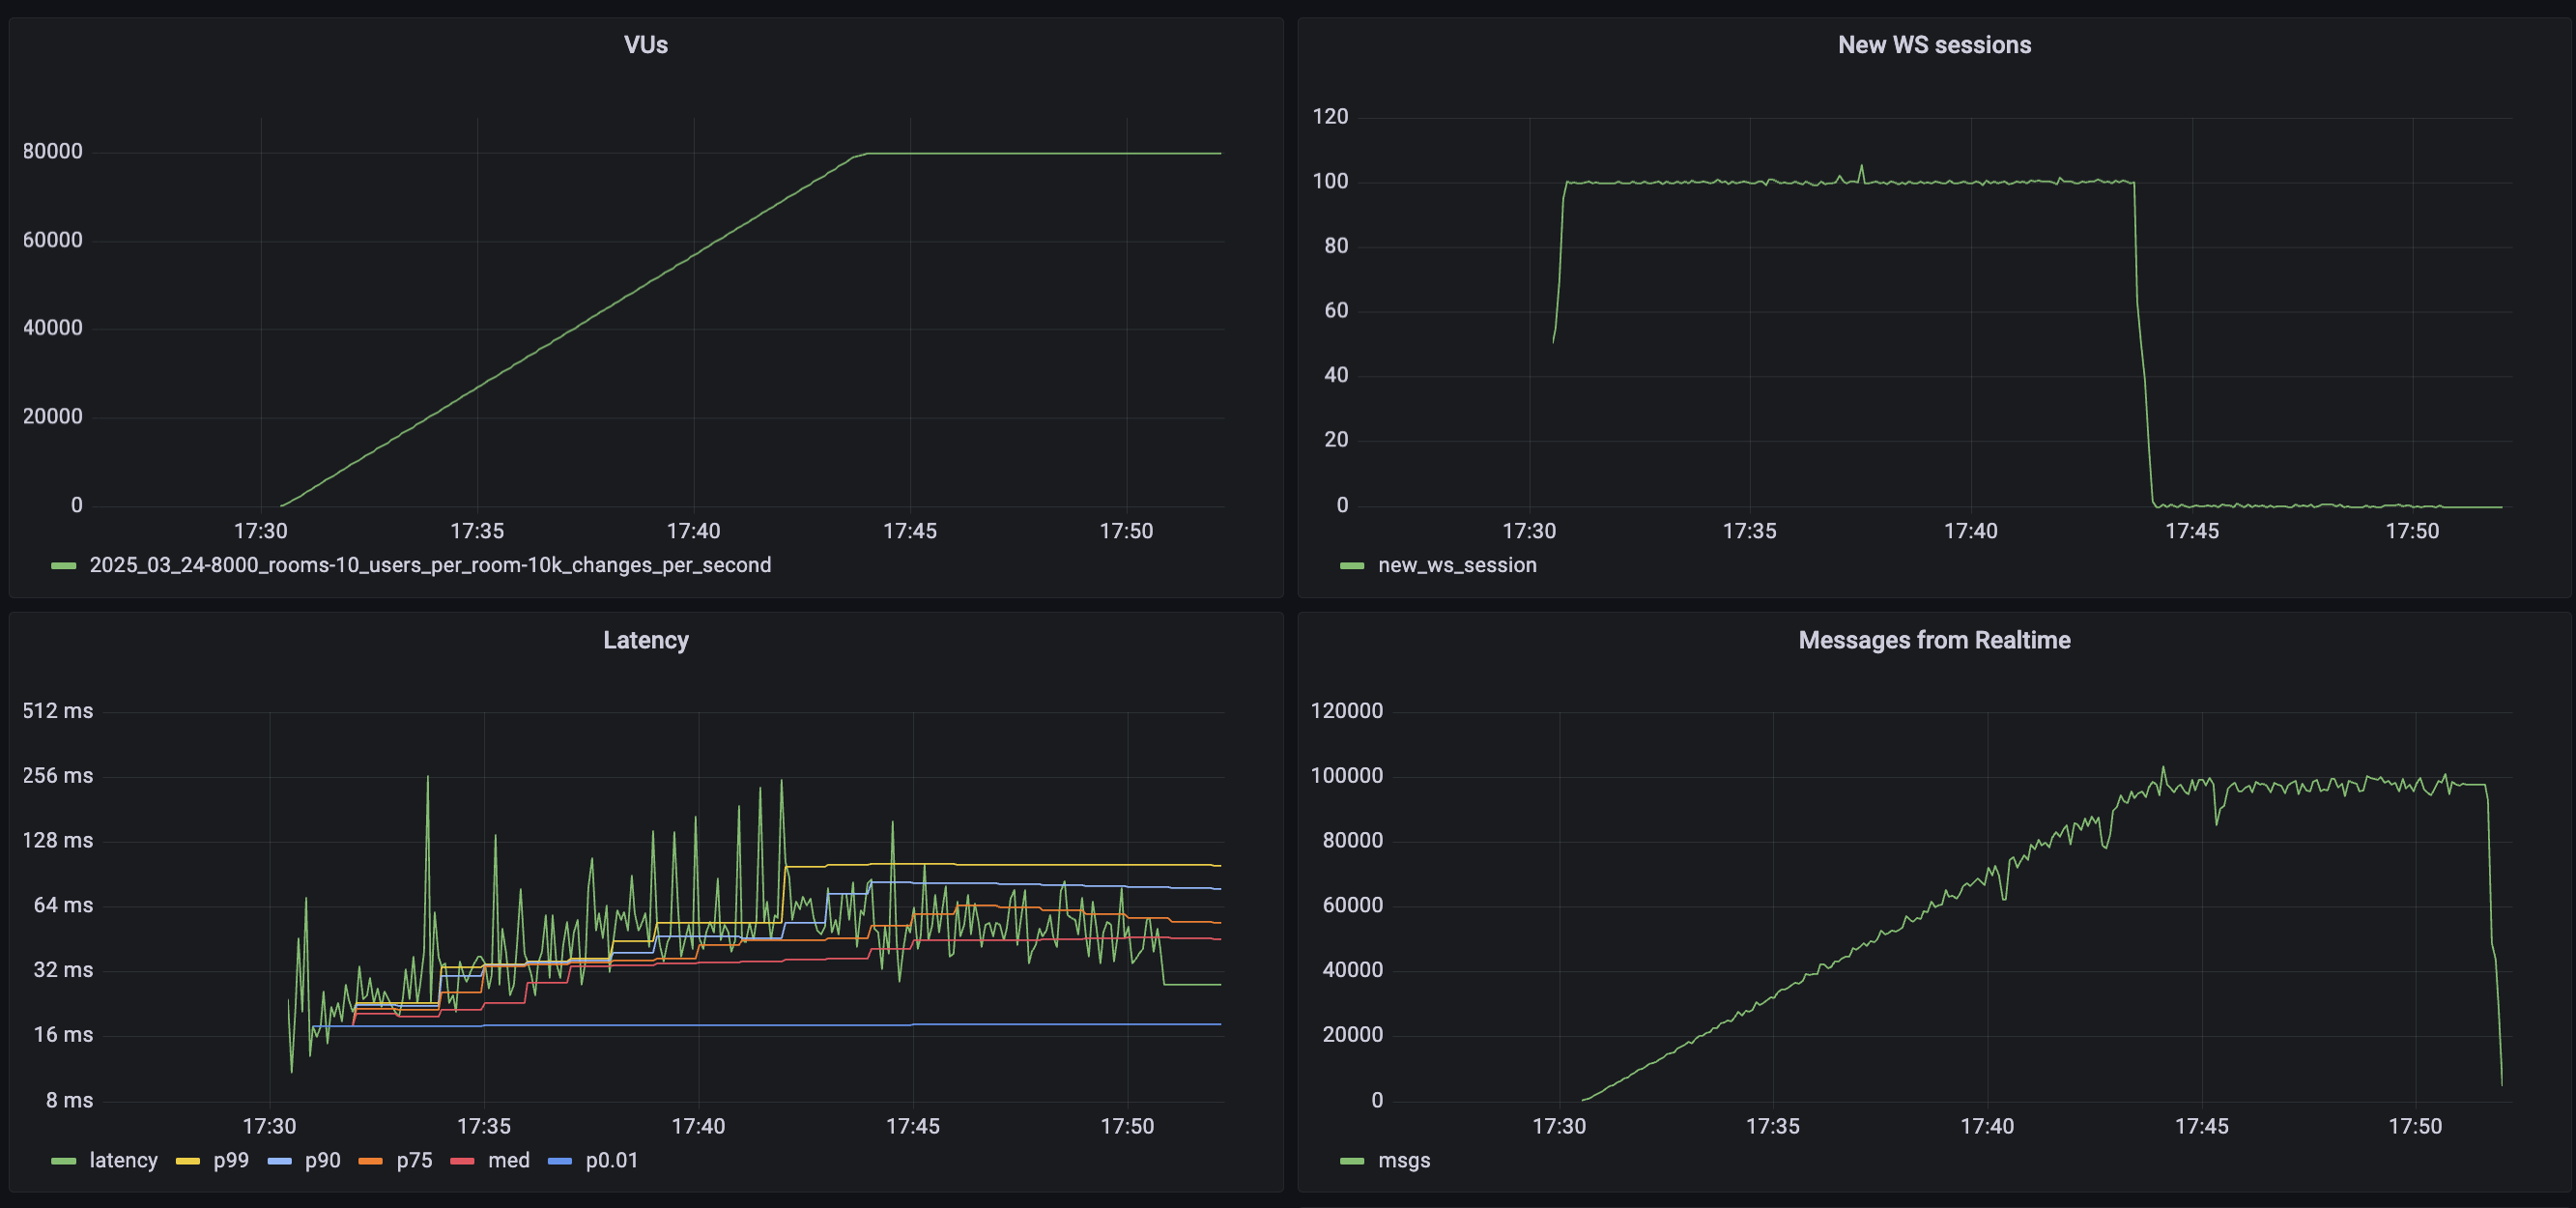
| Metric | Value |
|---|---|
| Concurrent Users | 80_000 |
| Total Channel Joins | 160_000 |
| Message Throughput | 10_000 msgs/sec |
| Median Latency | 46 ms |
| Latency (p95) | 132 ms |
| Latency (p99) | 159 ms |
| Data Received | 1.7 MB/s (42 GB total) |
| Data Sent | 0.4 MB/s (4 GB total) |
| New Connection Rate | 2000 conn/sec |
| Channel Join Rate | 4000 joins/sec |
Broadcast: Impact of payload size
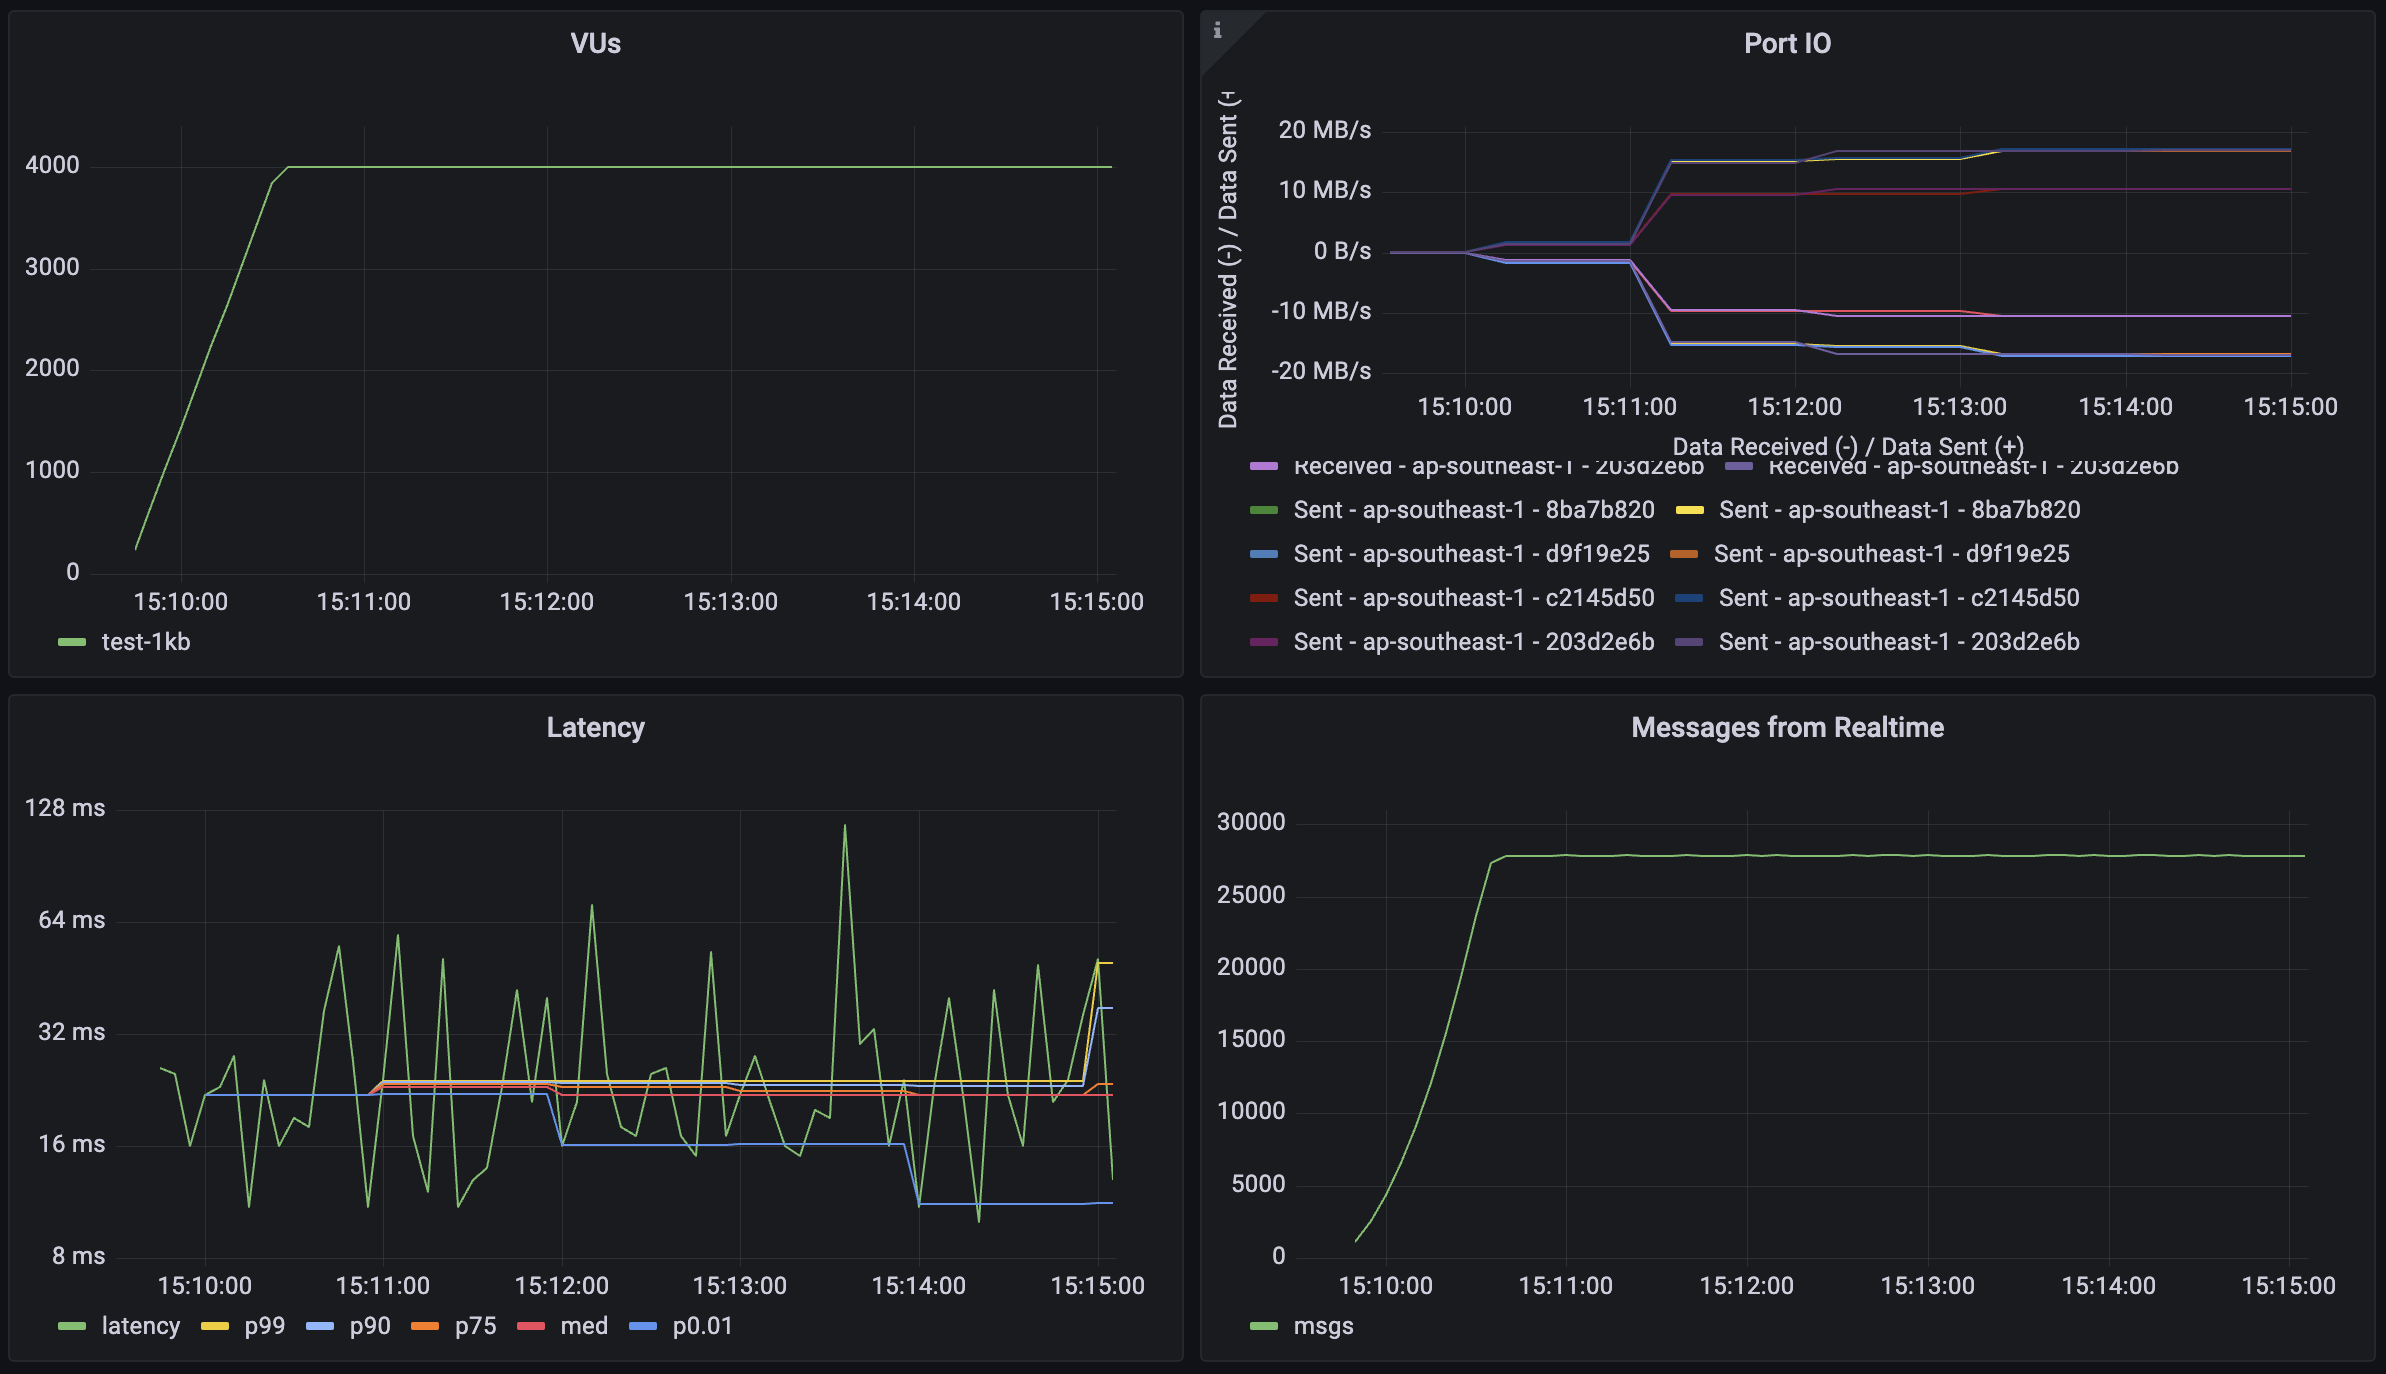
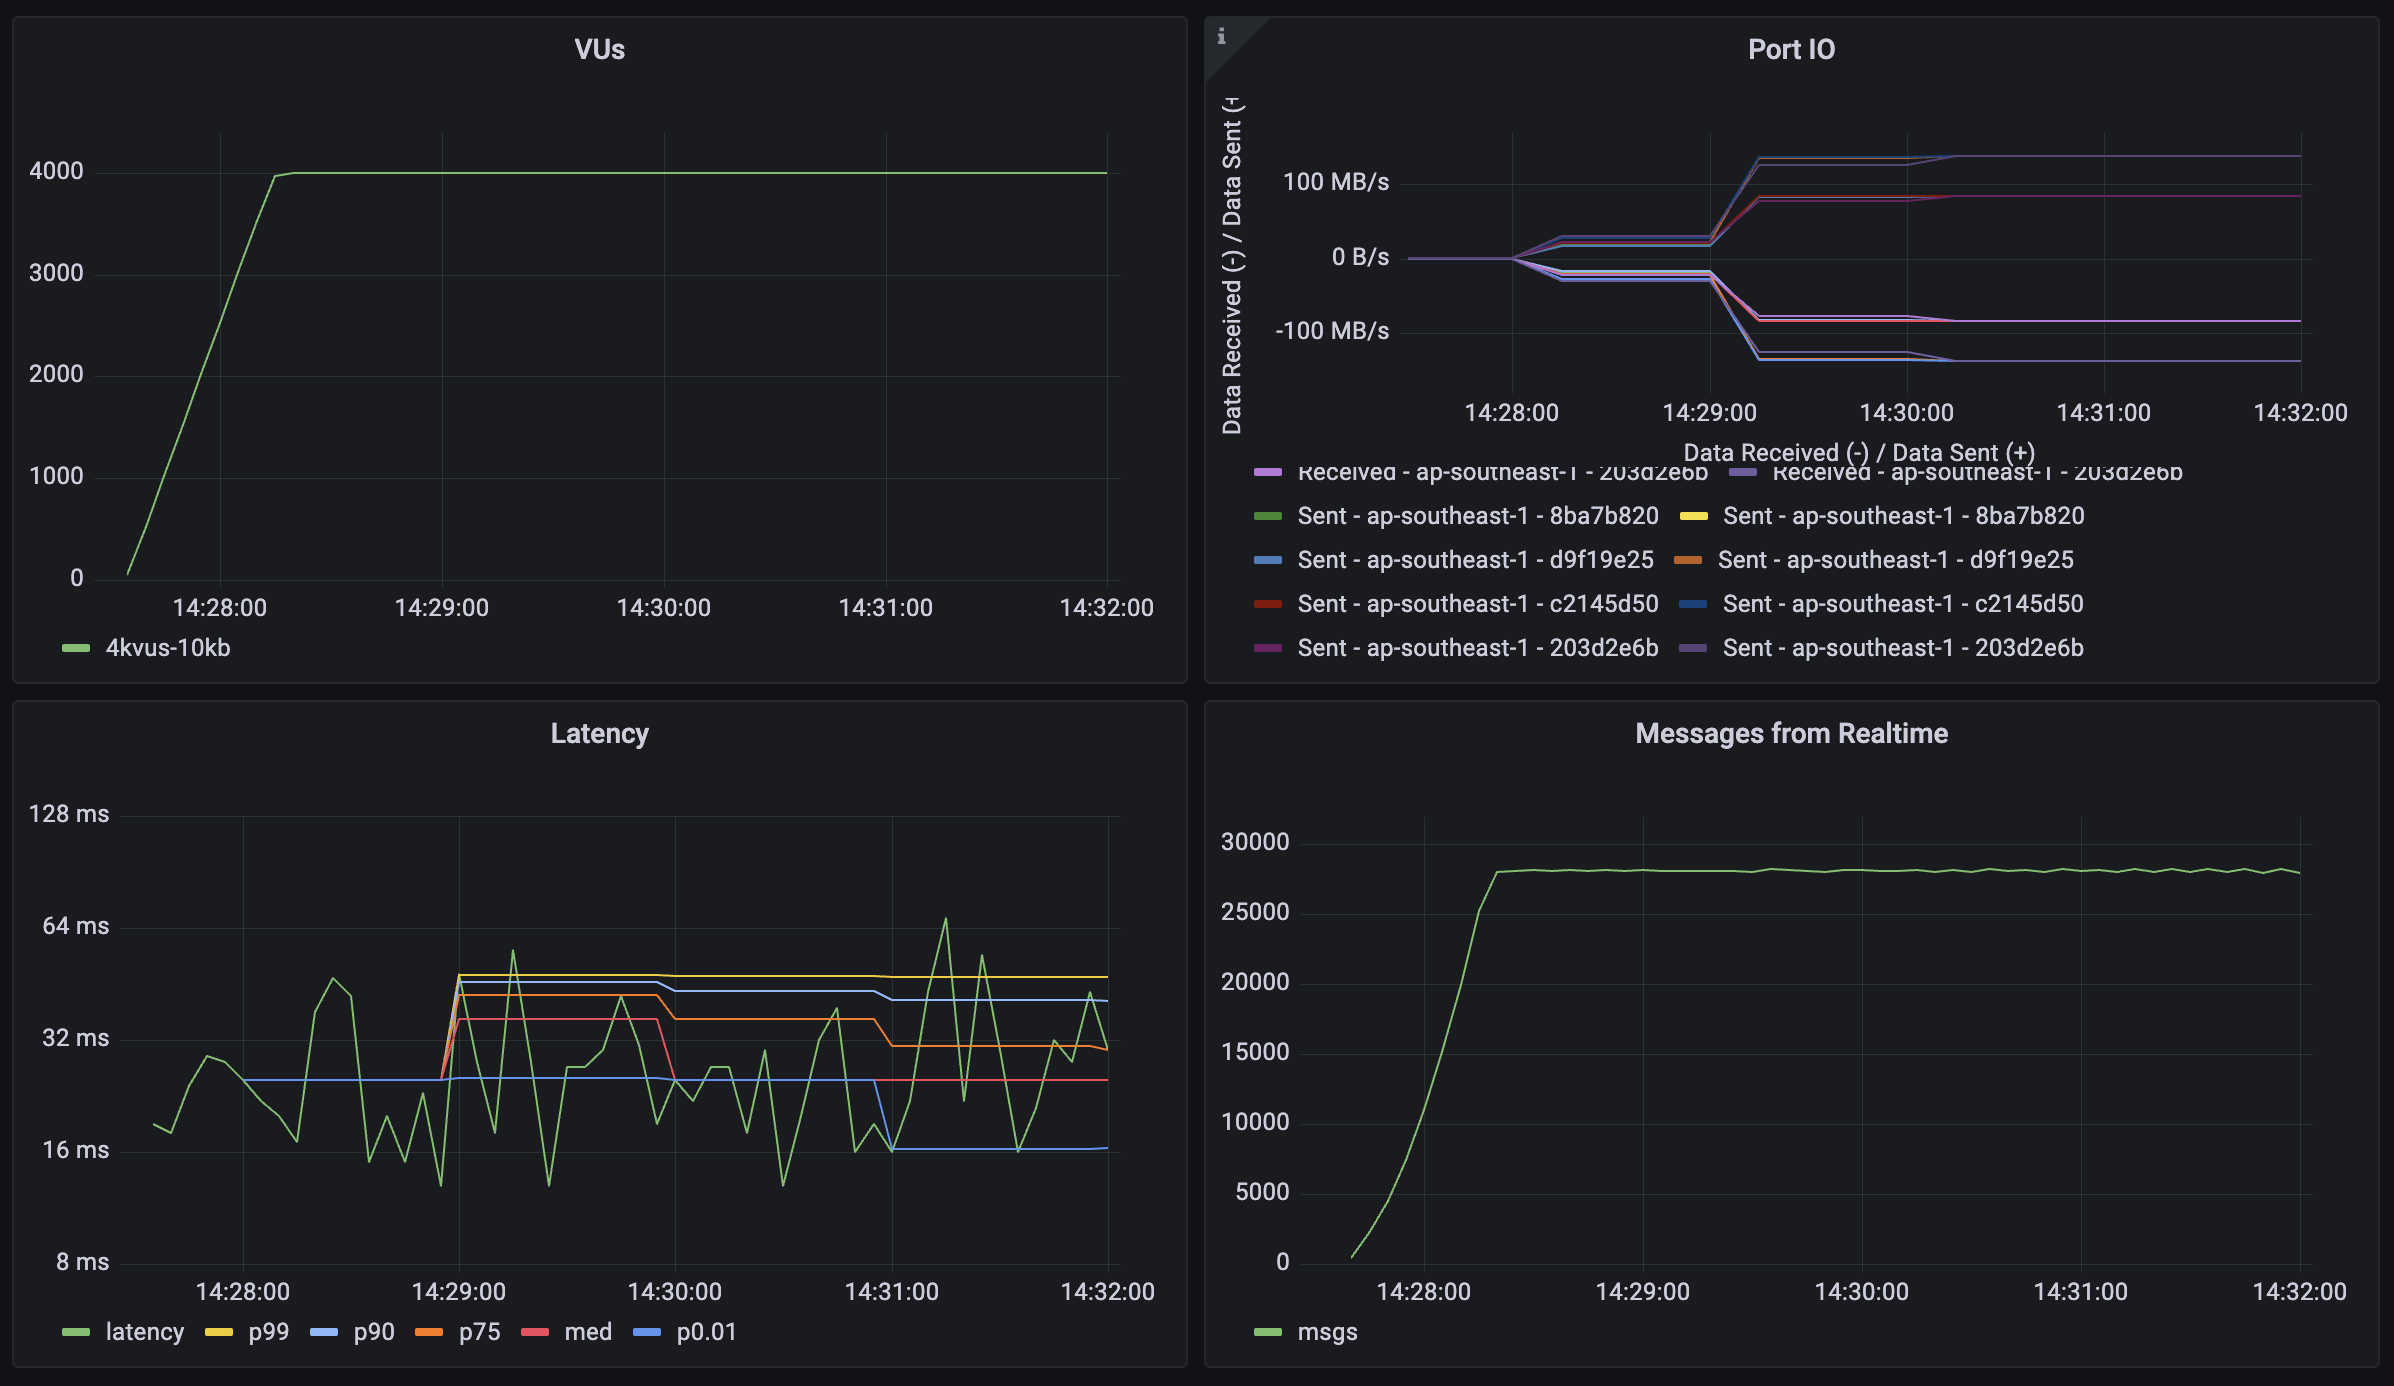
This workload tests the system's performance with different message payload sizes to understand how data volume affects throughput and latency. Each virtual user (VU) follows the same connection pattern as the broadcast test, but with varying message sizes:
- Establishes and maintains a WebSocket connection
- Joins two distinct channels:
- An echo channel (1 user per channel) for direct message reflection
- A broadcast channel (6 users per channel) for group communication
- Sends messages with payloads of 1KB, 10KB, and 50KB
- Generates traffic by sending 2 messages per second to each joined channel for 5 minutes
1KB payload
10KB payload
50KB payload
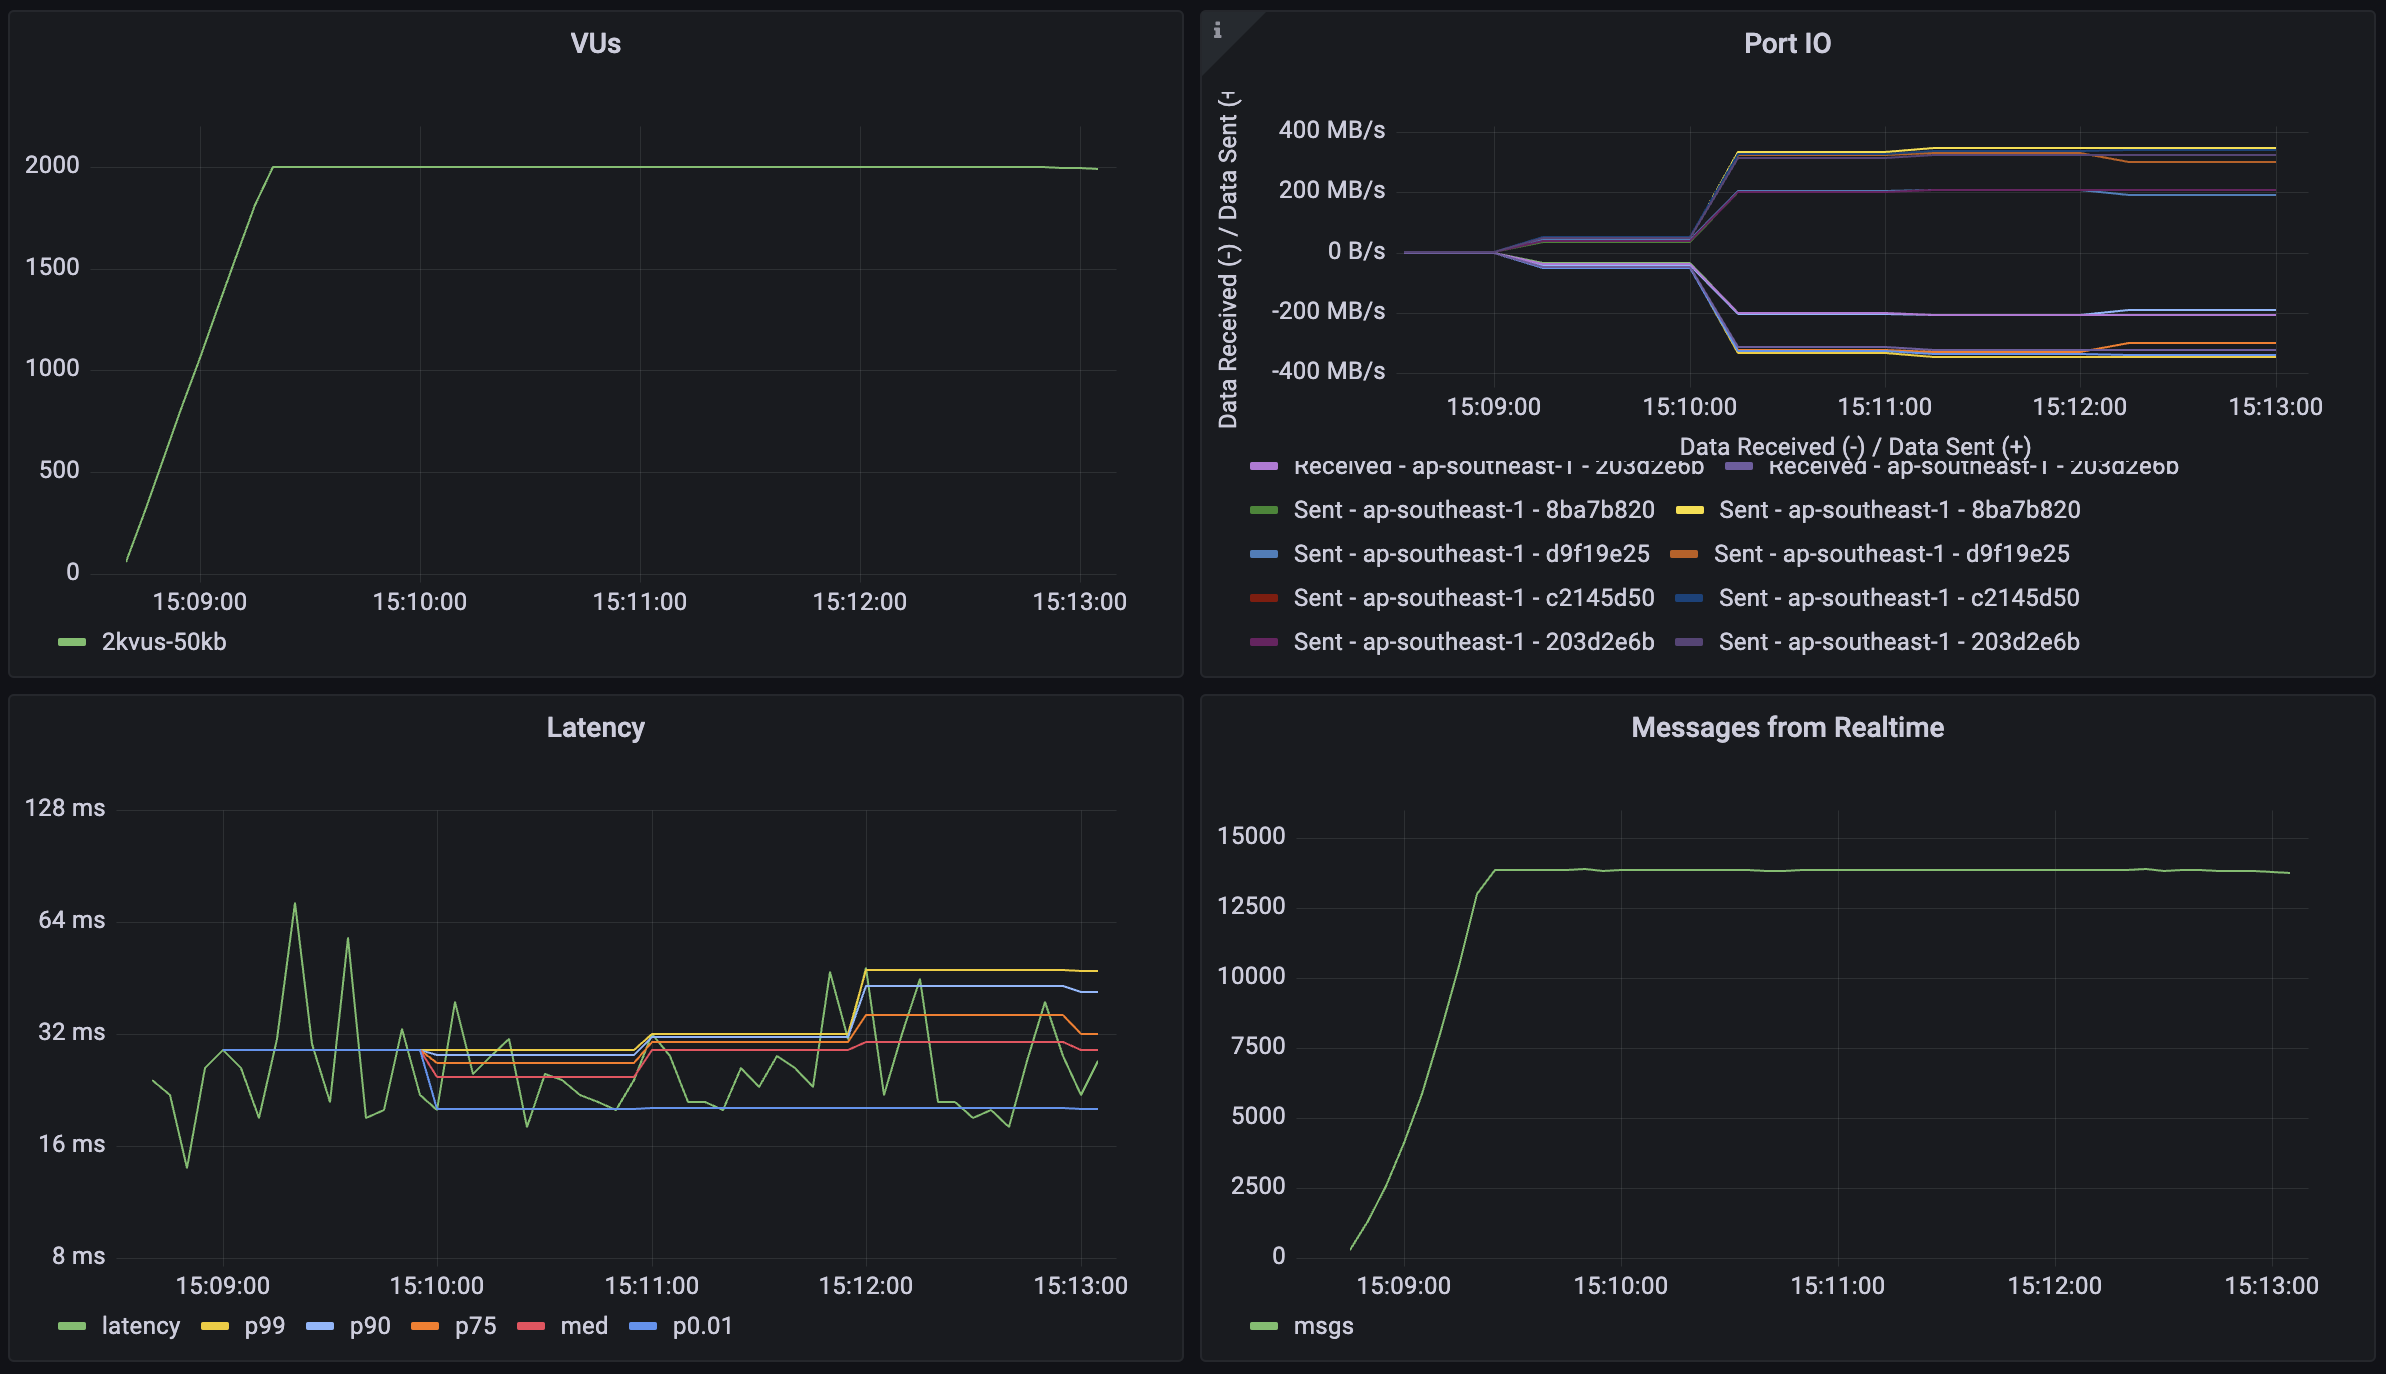
| Metric | 1KB Payload | 10KB Payload | 50KB Payload | 50KB Payload (Reduced Load) |
|---|---|---|---|---|
| Concurrent Users | 4_000 | 4_000 | 4_000 | 2_000 |
| Message Throughput | 28_000 msgs/sec | 28_000 msgs/sec | 28_000 msgs/sec | 14_000 msgs/sec |
| Median Latency | 13 ms | 16 ms | 27 ms | 19 ms |
| Latency (p95) | 36 ms | 42 ms | 81 ms | 39 ms |
| Latency (p99) | 85 ms | 93 ms | 146 ms | 82 ms |
| Data Received | 31.2 MB/s (10.4 GB) | 268 MB/s (72 GB) | 1284 MB/s (348 GB) | 644 MB/s (176 GB) |
| Data Sent | 9.2 MB/s (3.1 GB) | 76 MB/s (20.8 GB) | 384 MB/s (104 GB) | 192 MB/s (52 GB) |
Note: The final column shows results with reduced load (2,000 users) for the 50KB payload test, demonstrating how the system performs with larger payloads under different concurrency levels.
Broadcast: Scalability scenarios
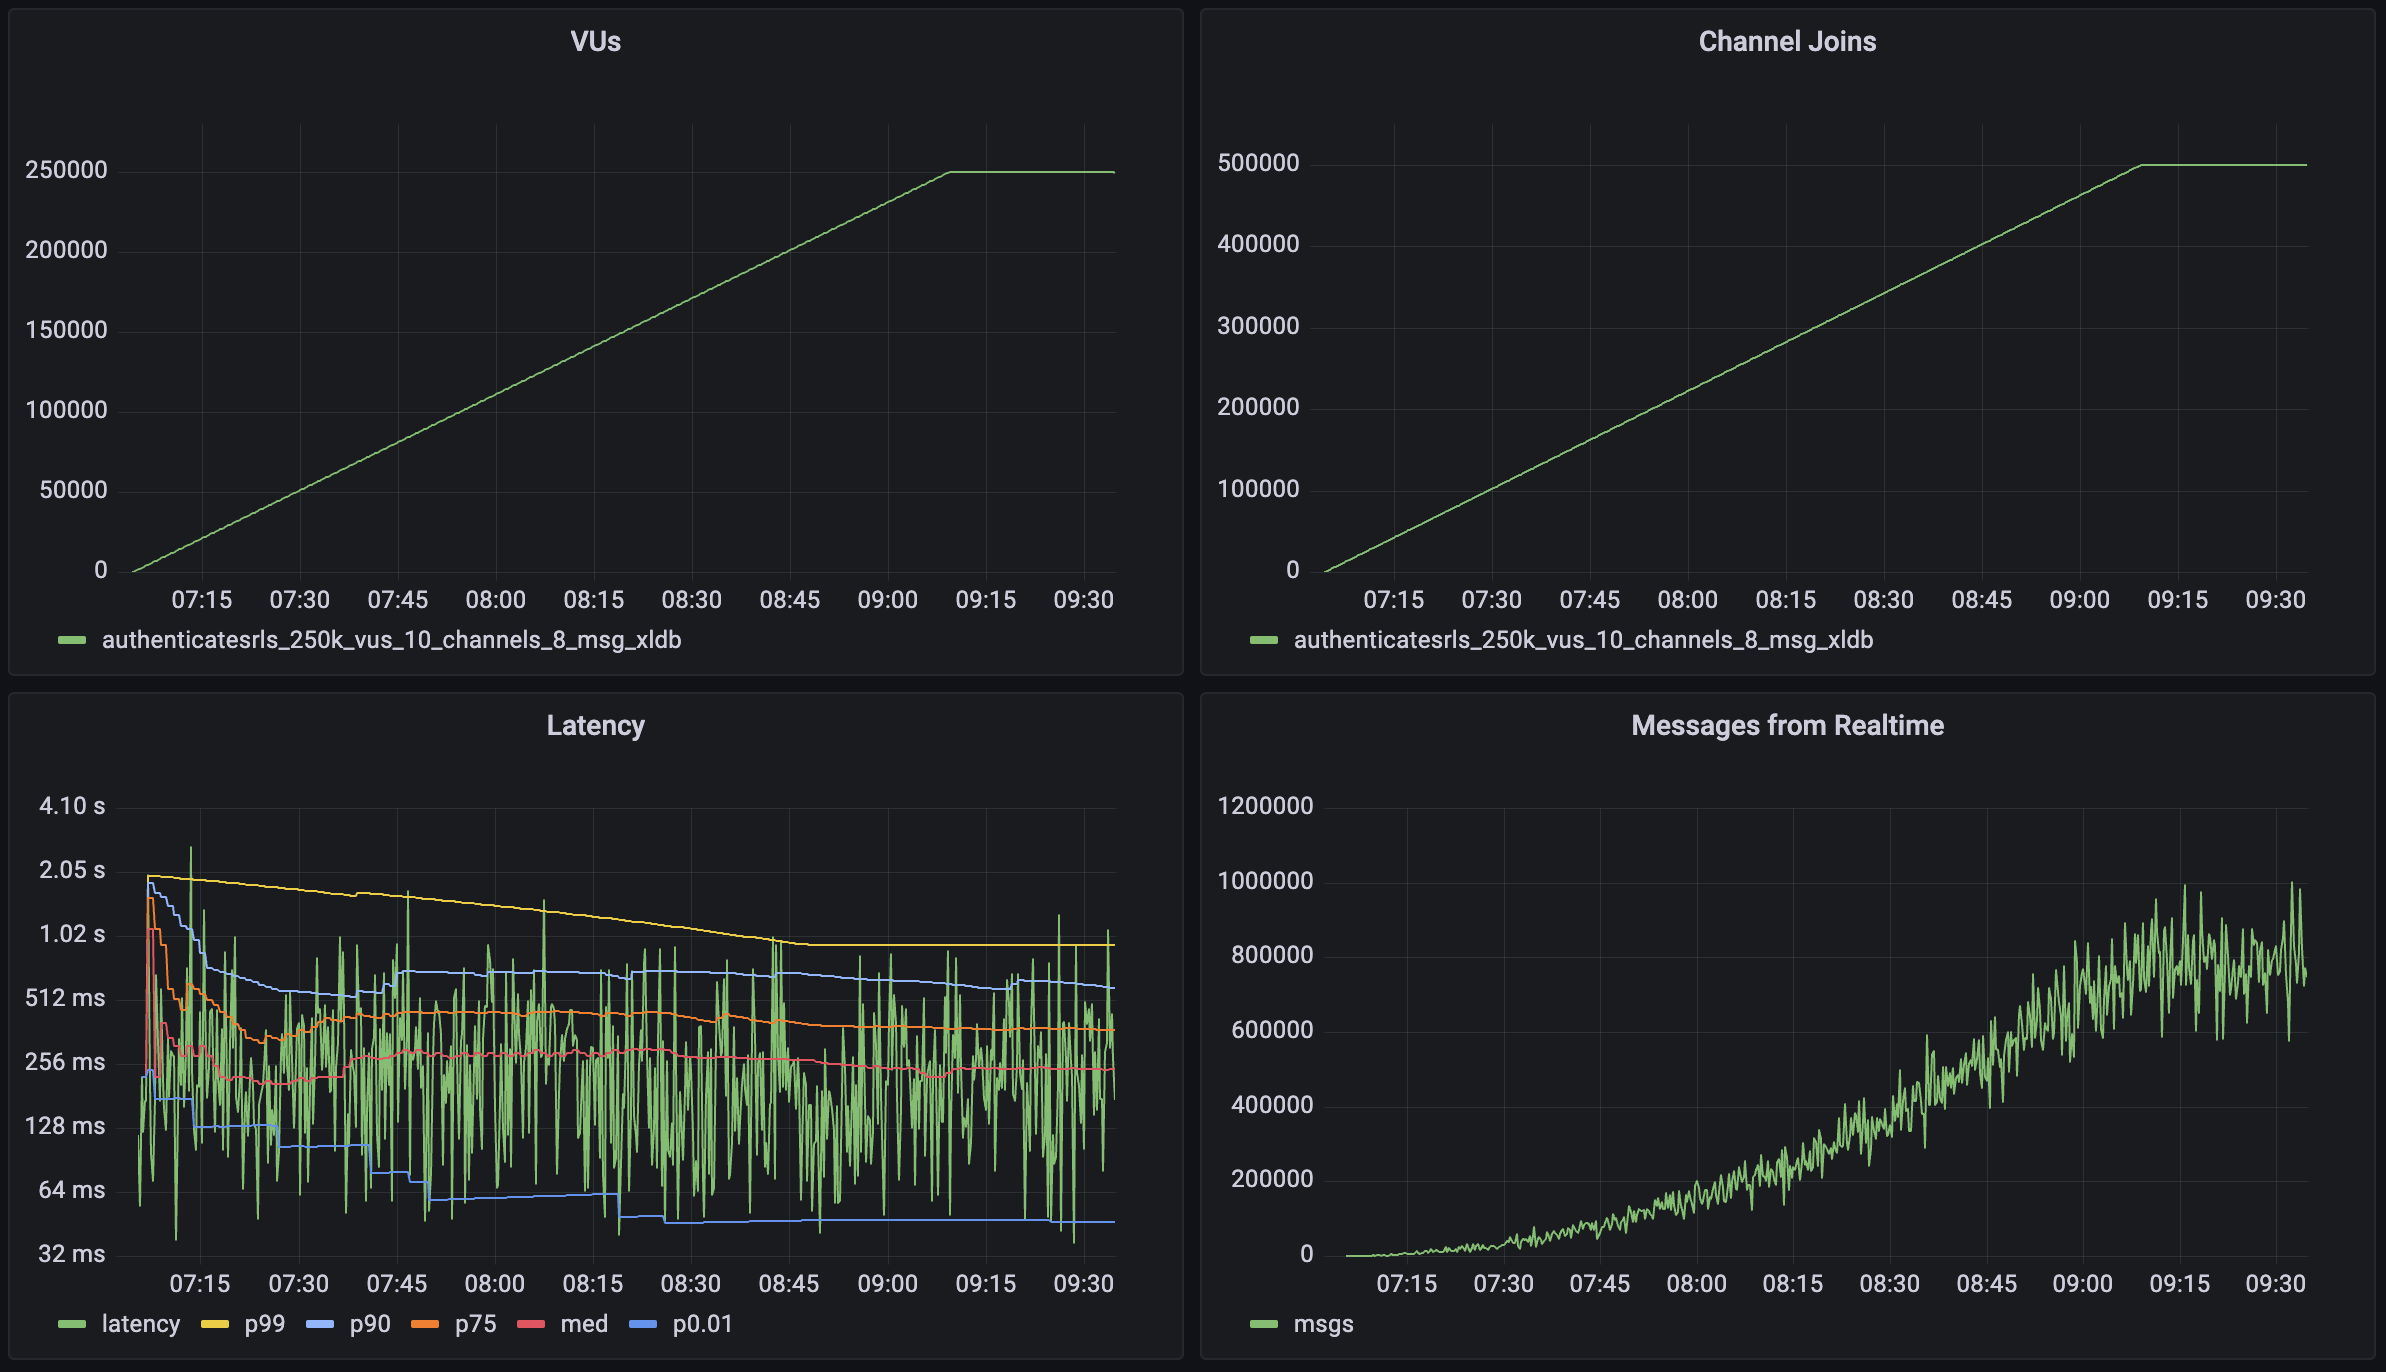
This workload demonstrates Realtime's capability to handle high-scale scenarios with a large number of concurrent users and broadcast channels. The test simulates a scenario where each user participates in group communications with periodic message broadcasts. Each virtual user (VU):
- Establishes and maintains a WebSocket connection (30-120 minutes)
- Joins 2 broadcast channels
- Sends 1 message per minute to each joined channel
- Each message is broadcast to 100 other users
| Metric | Value |
|---|---|
| Concurrent Users | 250_000 |
| Total Channel Joins | 500_000 |
| Users per Channel | 100 |
| Message Throughput | >800_000 msgs/sec |
| Median Latency | 58 ms |
| Latency (p95) | 279 ms |
| Latency (p99) | 508 ms |
| Data Received | 68 MB/s (600 GB) |
| Data Sent | 0.64 MB/s (5.7 GB) |
Realtime Auth
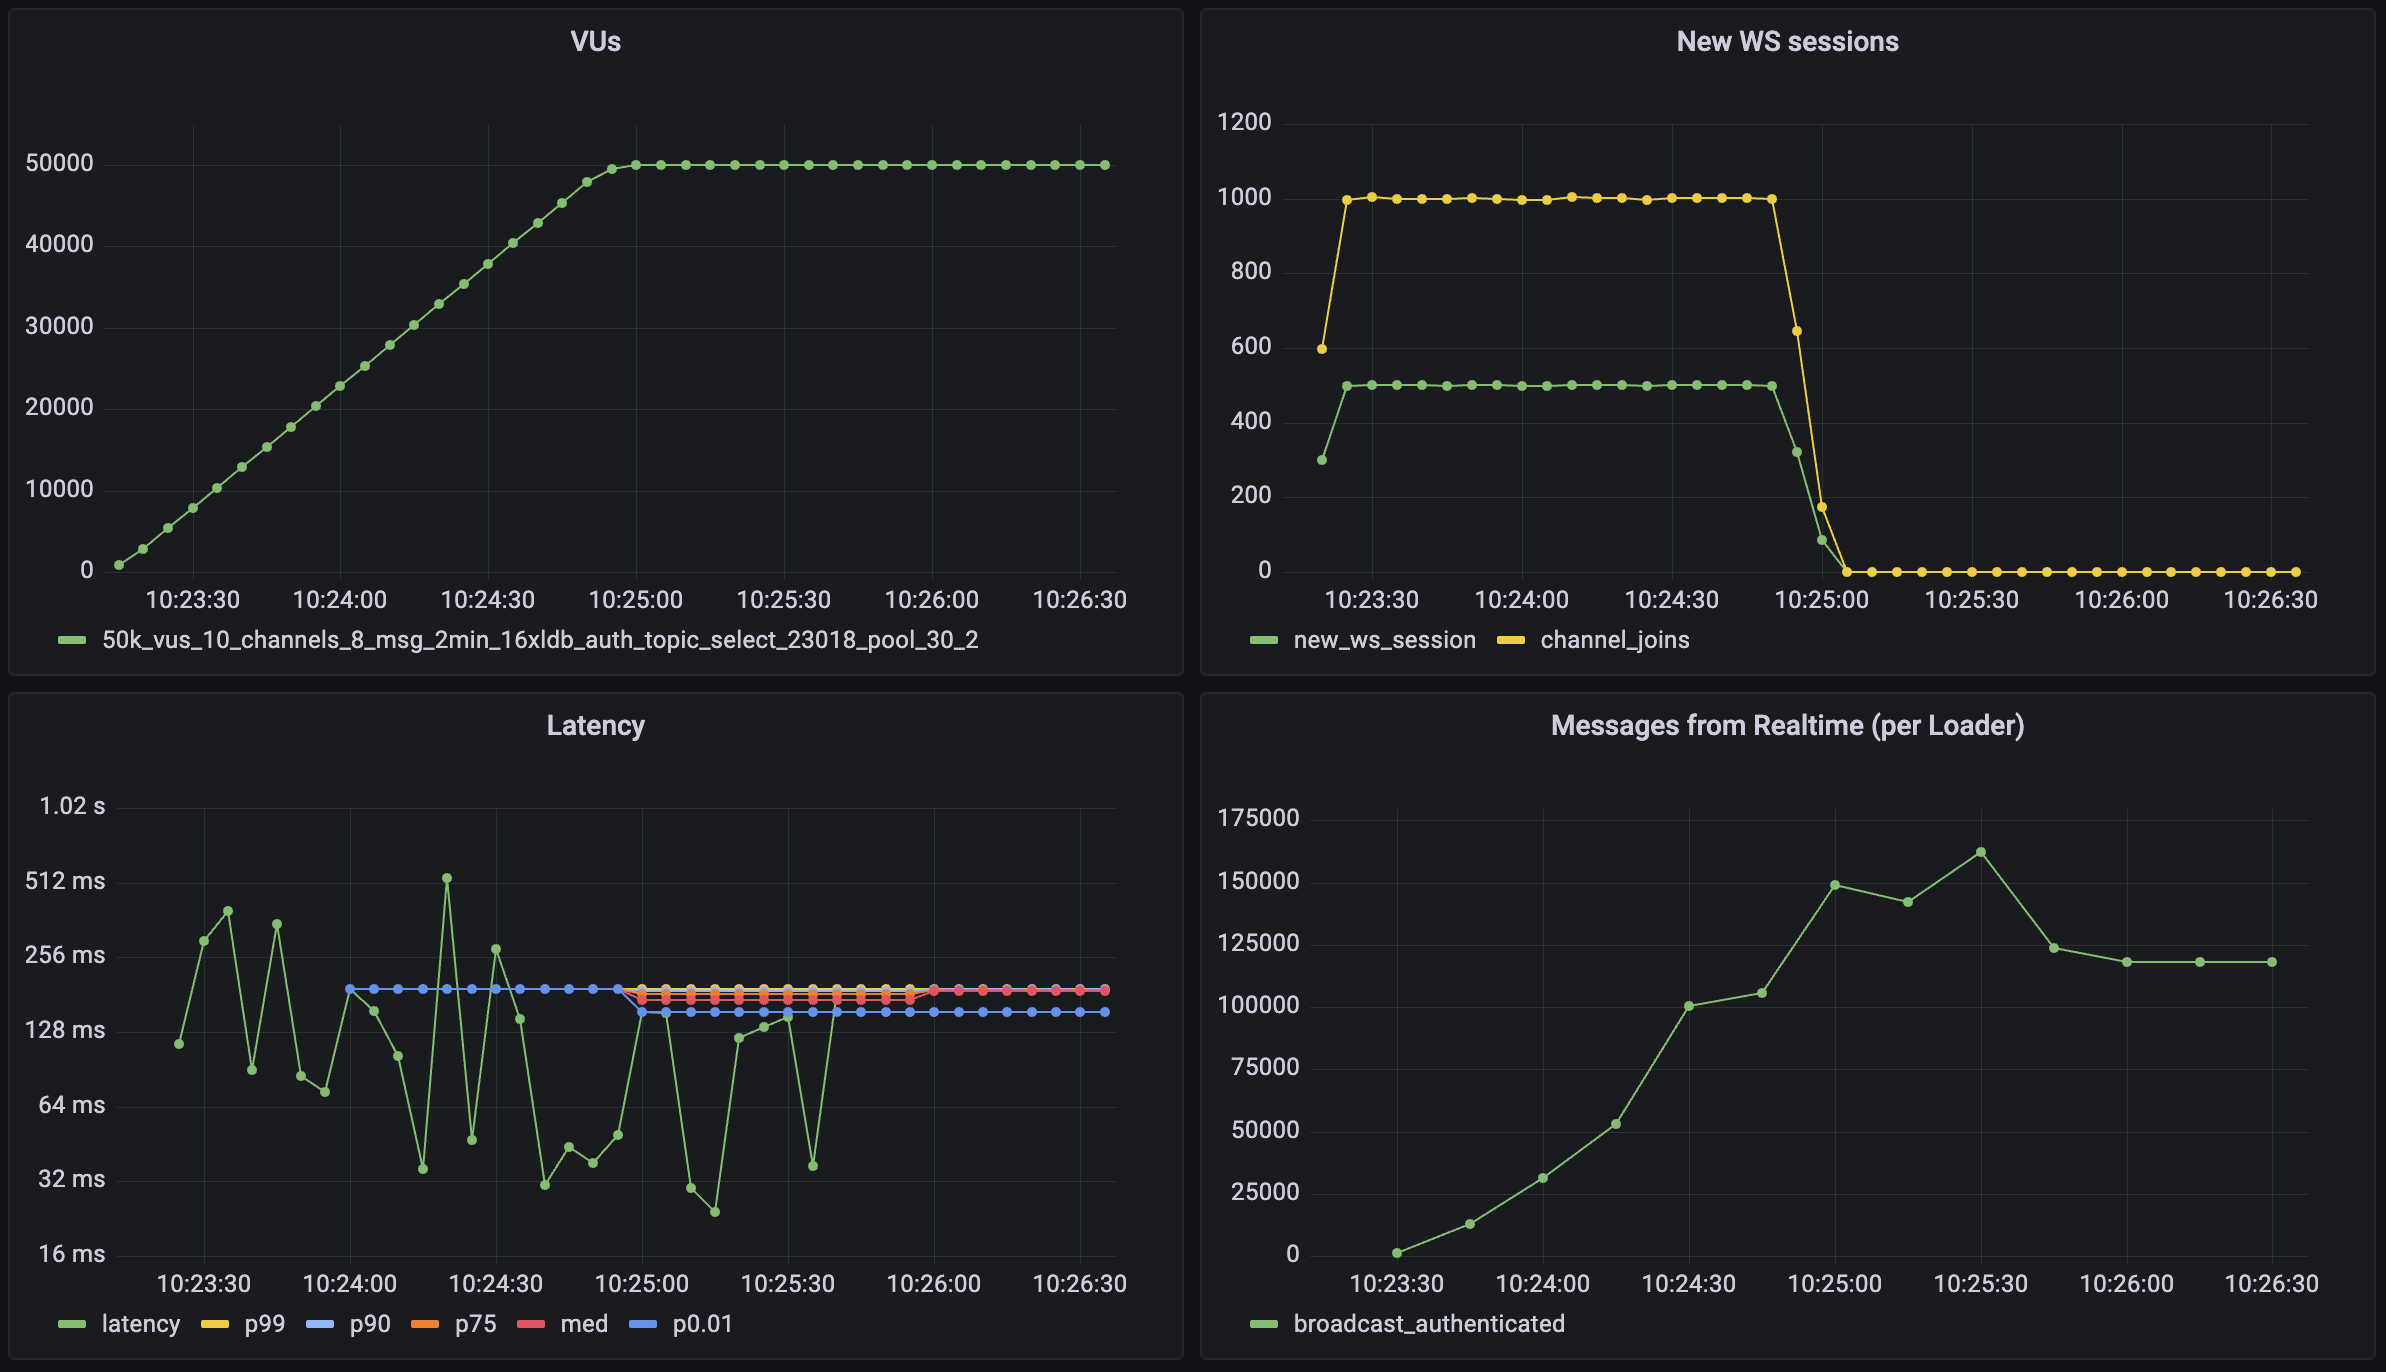
This workload demonstrates Realtime's capability to handle large amounts of new connections per second and channel joins per second with Authentication Row Level Security (RLS) enabled for these channels. The test simulates a scenario where large volumes of users connect to realtime and participate in auth protected communications. Each virtual user (VU):
- Establishes and maintains a WebSocket connection (2.5 minutes)
- Joins 2 broadcast channels
- Sends 1 message per minute to each joined channel
- Each message is broadcast to 100 other users
| Metric | Value |
|---|---|
| Concurrent Users | 50_000 |
| Total Channel Joins | 100_000 |
| Users per Channel | 100 |
| Message Throughput | >150_000 msgs/sec |
| New Connection Rate | 500 conn/sec |
| Channel Join Rate | 1000 joins/sec |
| Median Latency | 19 ms |
| Latency (p95) | 49 ms |
| Latency (p99) | 96 ms |
Postgres Changes
Realtime systems usually require forethought because of their scaling dynamics. For the Postgres Changes feature, every change event must be checked to see if the subscribed user has access. For instance, if you have 100 users subscribed to a table where you make a single insert, it will then trigger 100 "reads": one for each user.
There can be a database bottleneck which limits message throughput. If your database cannot authorize the changes rapidly enough, the changes will be delayed until you receive a timeout.
Database changes are processed on a single thread to maintain the change order. That means compute upgrades don't have a large effect on the performance of Postgres change subscriptions. You can estimate the expected maximum throughput for your database below.
If you are using Postgres Changes at scale, you should consider using a separate "public" table without RLS and filters. Alternatively, you can use Realtime server-side only and then re-stream the changes to your clients using a Realtime Broadcast.
Enter your database settings to estimate the maximum throughput for your instance:
Set your expected parameters
Current maximum possible throughput
| Total DB changes /sec | Max messages per client /sec | Max total messages /sec | Latency p95 |
|---|---|---|---|
| 64 | 64 | 32,000 | 238ms |
View raw throughput table
Don't forget to run your own benchmarks to make sure that the performance is acceptable for your use case.
Supabase continues to make improvements to Realtime's Postgres Changes. If you are uncertain about your use case performance, reach out using the Support Form. The support team can advise on the best solution for each use-case.